
🪄 AI Summary
Heading 1
Heading 2
Heading 3
Heading 4
Heading 5
Heading 6
Lorem ipsum dolor sit amet, consectetur adipiscing elit, sed do eiusmod tempor incididunt ut labore et dolore magna aliqua. Ut enim ad minim veniam, quis nostrud exercitation ullamco laboris nisi ut aliquip ex ea commodo consequat. Duis aute irure dolor in reprehenderit in voluptate velit esse cillum dolore eu fugiat nulla pariatur.
Block quote
Ordered list
- Item 1
- Item 2
- Item 3
Unordered list
- Item A
- Item B
- Item C
Bold text
Emphasis
Superscript
Subscript
Most B2B SaaS teams producing short-form video are tracking the wrong things. Views feel like progress. They rarely are. The real question, how do you measure short-form video success, requires a layer of metrics most teams never see inside their content performance dashboard. This guide breaks down the exact KPIs that matter for founders, marketing heads, and growth teams: from platform-specific engagement benchmarks, to completion rates, to tying video directly to pipeline. No vanity metrics. Only what moves buyers.
TL;DR
- Watch time and completion rate outrank raw views as short-form success signals on every major platform.
- Engagement rate benchmarks differ sharply across TikTok, Reels, and YouTube Shorts, know your platform's standard before judging performance.
- Reach and impressions measure different things; confusing them leads to misread reports.
- For B2B SaaS, pipeline signals (demo requests, inbound DMs, MQL sourcing) are the ultimate measure of video ROI.
What Metrics Matter Most for Short-Form Video?
Before obsessing over any single number, you need a framework that separates distribution metrics from engagement metrics from business metrics. These three layers answer different questions and should never be collapsed into one.
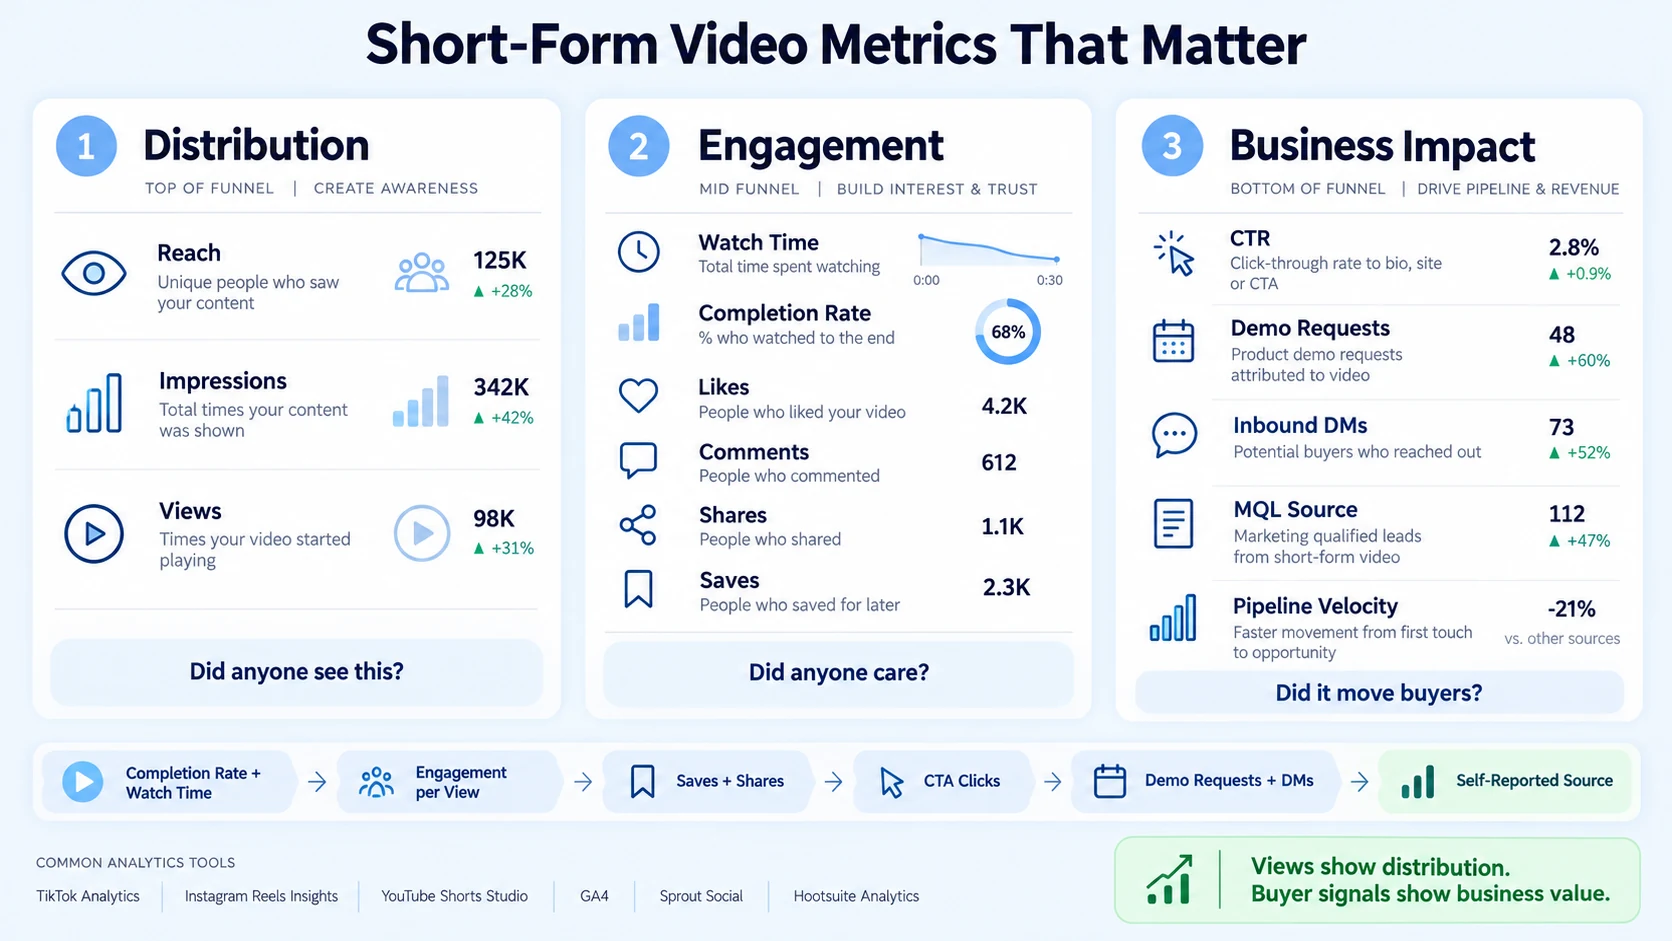
- Distribution metrics tell you how far your content traveled. Reach, impressions, and views belong here. They answer: did anyone see this?
- Engagement metrics tell you how your content landed. Watch time, completion rate, likes, comments, shares, and saves belong here. They answer: did anyone care?
- Business metrics tell you whether any of it worked commercially. Demo requests, inbound DMs attributable to video, MQL source data, and pipeline velocity belong here. They answer: did it move buyers?
According to the 2025 Sprout Social Index, overall engagement is the primary metric marketing leaders use to measure social media success. That track. But for B2B SaaS teams, engagement is the middle layer, necessary but not sufficient on its own. 41% of B2B marketers say that, of all video formats, short-form drives the highest ROI. The teams capturing that ROI aren't the ones with the most views. They're the ones tracking the right signals at each layer of the funnel.
Here is the priority order I recommend for any SaaS or funded AI/tech team:
- Completion rate and average watch time (platform algorithm signals)
- Engagement rate per view (quality of audience response)
- Saves and shares (intent signals that indicate buyer-relevant content)
- Click-through rate on CTAs (mid-funnel transition)
- Demo requests and inbound DMs attributed to video (pipeline)
- Self-reported source data from leads ("how did you hear about us?")
The tools to track these: TikTok Analytics, Instagram Reels Insights, YouTube Shorts Studio, Google Analytics 4 for downstream traffic, and Sprout Social or Hootsuite Analytics for cross-platform views. You can also connect video traffic flows into GA4 through UTM-tagged links in bios and captions.
Best KPIs for TikTok and Reels Performance
Platform benchmarks are the only honest reference point. Without them, you're judging your numbers in a vacuum. Engagement rate averages in 2026: TikTok averages 2.50 -- 4.64%, Instagram Reels sits at 0.50 -- 1.48%, and YouTube Shorts pulls 3.4 -- 5.91%.
If your engagement rate per view exceeds 5% on TikTok, 1.5% on Instagram Reels, or 4% on YouTube Shorts, you're above average.
Two additional KPIs that belong in your weekly review:
Share velocity: How fast a video accumulates shares in its first 24–48 hours. High share velocity is the clearest early signal that content is resonating beyond your existing audience, a proxy for the video virality coefficient platforms use to decide distribution scale.
Save rate (Reels): Saves on Instagram Reels signal high-intent engagement. When a B2B buyer saves a video about your product, they're flagging it for later reference, that's buyer behavior, not casual scrolling.
TikTok videos of 15 to 30 seconds earn the highest engagement rate at 6.00%. For SaaS teams making product clips or founder-led videos, keeping delivery tight under 30 seconds on TikTok and under 60 seconds on Shorts gives you the best algorithmic footing. Our short-form video editing service is built around these platform-specific length and hook requirements.
Are Views or Watch Time More Important for Short-Form Video?
This is the most common measurement debate I hear from SaaS founders and marketing leads, so let me answer it directly: watch time wins. View counts are vanity metrics. A video with 500,000 views that nobody actually watched won't do much for your growth, your algorithm standing, or your business.
Watch time, specifically completion rate and average view duration, is what platforms use to decide whether to amplify your content. When your completion rate is high, the algorithm interprets that as a signal the content is worth pushing to more of the same audience type. That's the mechanism behind organic reach expansion.
On TikTok, the average retention rate for videos under 30 seconds increased from approximately 45% in 2025 to 50% in 2026. The completion rate benchmark for YouTube Shorts in the 15 to 30 second range moved from 35% to 40% as a threshold for strong algorithmic treatment. 71% of viewers decide within the first few seconds whether a video is worth continuing. This is why hook quality, the first 3 seconds, is the single highest-leverage editing decision for any short-form clip.
For B2B SaaS teams specifically, watch time has a second dimension. A prospect who watches 85% of a 60-second product explainer has absorbed more information than one who clicked a blog post and bounced in 12 seconds. The Audience Retention Graph in YouTube Shorts Studio shows you exactly where drop-off happens, which is the edit note, not just a performance score.
The practical rule: optimize for completion first, views second. A 60% completion rate on 2,000 views beats a 15% completion rate on 20,000 views, both for the algorithm and for actual buyer education.
Reach vs. Impressions on Short Videos: What's the Difference?
These terms appear in every analytics dashboard and get confused constantly. The distinction matters because each one tells you something different about your content's performance. In simple terms, reach is the number of unique users who see your content, while impressions count the total times the content is displayed, including repeat views by the same person.
Put differently: reach tells you how many people you got in front of, and impressions tell you how many total exposures you bought or earned.
One important 2026 platform update to know: Meta retired the "Impressions" metric for organic Instagram and Facebook content and replaced it with a single "Views" metric across Reels, Stories, carousels, photos and Live, fully in effect since April 21, 2025. The old reach-and-impressions wording still lives in paid Ads Manager, which keeps reporting reach, impressions and frequency exactly as it always has.
For YouTube Shorts, the picture is slightly different. YouTube impressions measure how many times at least 50% of your video thumbnail was visible on screen for at least one second, and impression click-through rate shows how often viewers watched after seeing it.
Here's how to use each metric practically:
- Reach: Use it to track brand awareness growth. Rising reach on short videos means you're penetrating new audiences. This is your top-of-funnel signal.
- Impressions/Views: Use it to track content frequency and algorithm favor. High impression-to-reach ratio means the same people are seeing your content repeatedly, useful for reinforcing brand recognition, but it also means you need fresh content to expand.
- Impression CTR (YouTube): This one matters for SaaS teams. It tells you whether your thumbnail and title are compelling buyers to click through to the full video.
How to Track Engagement Rate on Short-Form Video
Engagement rate is a calculated metric, not a native readout in most dashboards. You have to build it, and the formula varies by platform.
The formula is: (Likes + Comments + Shares) / Views × 100.
For Shorts, also measure completion rate (complete plays / total plays) and view-through rate (average watch time / total duration).
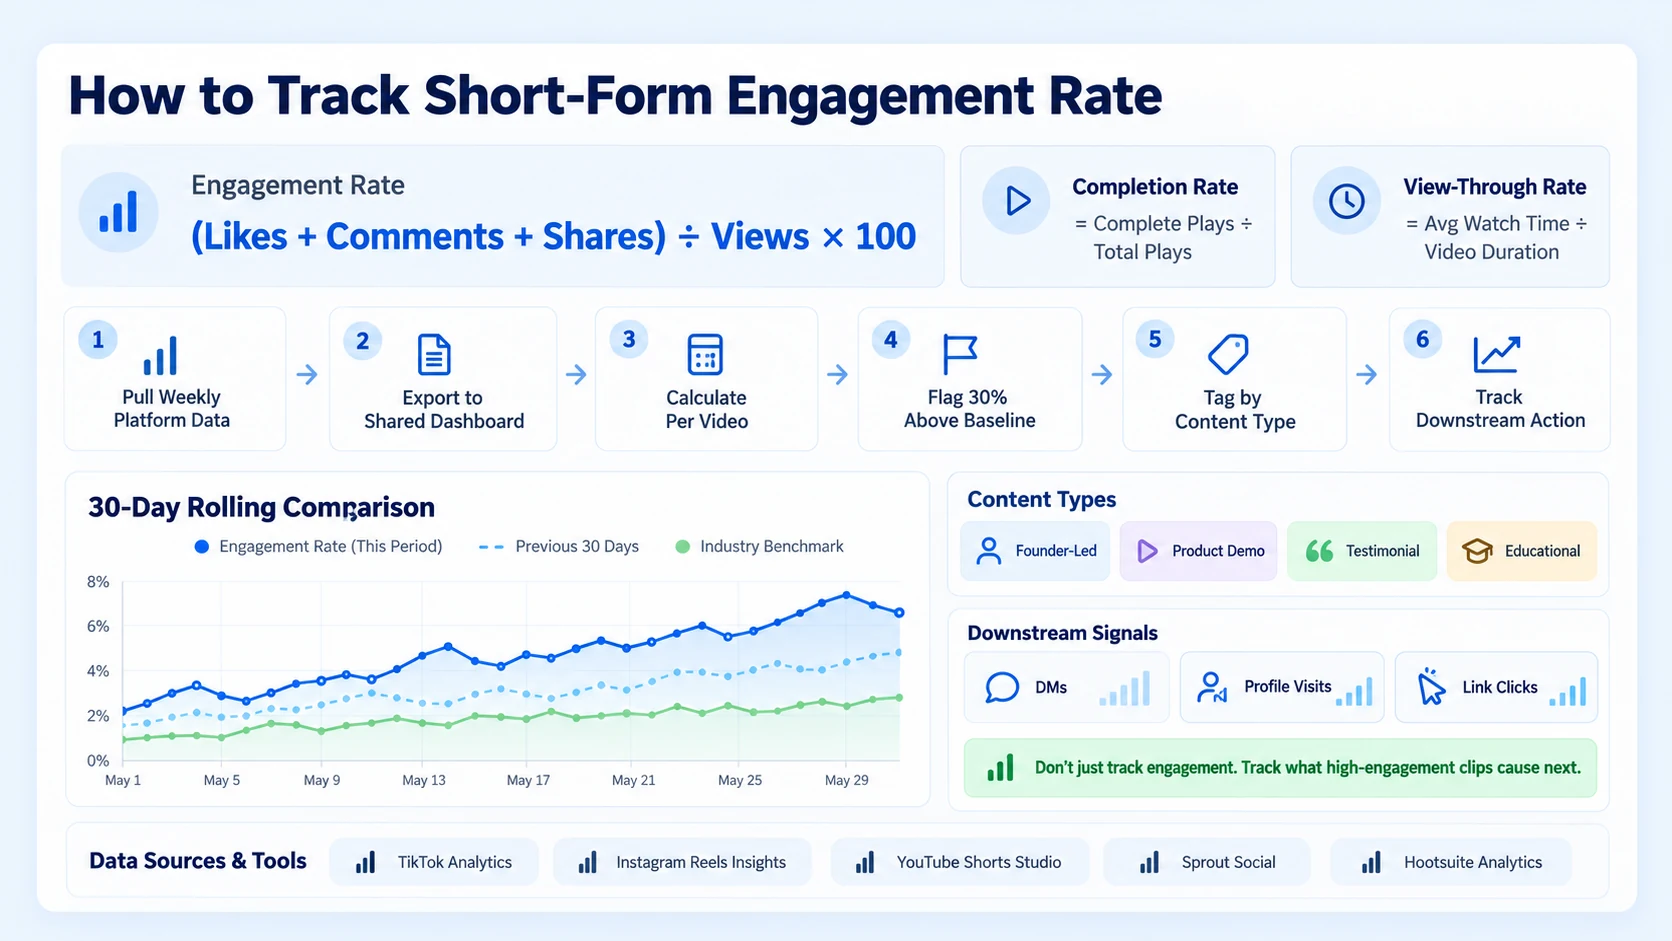
Here is how I track engagement rate across platforms inside a unified content performance dashboard:
- Pull raw data from TikTok Analytics, Instagram Reels Insights, and YouTube Shorts Studio weekly.
- Export to a shared spreadsheet or connect to Sprout Social or Hootsuite Analytics for aggregated views.
- Calculate engagement rate per video using the formula above.
- Flag any video that performs 30% above your current baseline, that's your signal to analyze the hook, format, and topic for replication.
- Tag content by type (founder-led, product demo, testimonial, educational) and compare engagement rate by type across a 30-day rolling window.
- Add a column for downstream action: did this video generate a DM, a profile visit spike, or a link click?
Accounts with fewer than 100K followers on TikTok average 7.50% engagement, versus 2.88% for 10M+ accounts. This matters for B2B teams: your benchmark is not the same as a mass-consumer creator. Founder-led accounts for B2B SaaS regularly outperform blended industry averages because the content is specific and the audience self-selects.
Reels consistently achieve 2–3× higher engagement than standard feed posts on the same account. If your team is still prioritizing static posts over Reels on Instagram, the engagement gap is your cost.
For teams producing content from webinars, podcasts, or events, each source asset is worth tracking separately. Clips from a live session often outperform scripted content in engagement rate because they carry authentic delivery and real audience reaction.
How to Measure ROI on Short-Form Video Content
This is the section most B2B teams skip to, and the hardest to answer well. The honest answer is that short-form video ROI lives across two layers: platform performance ROI and pipeline ROI.
Platform performance ROI is measurable directly. 93% of marketers say video has given them a good ROI, with 49% ranking short-form video as the top ROI format. Landing pages with embedded video convert at 86% higher rates than text-only equivalents, with the effect strongest for complex products, B2B SaaS pages with explainer videos see conversion lifts exceeding 100% in controlled testing.
Pipeline ROI requires connecting video signals to CRM and sales data. The metrics that bridge that gap:
- Demo request volume correlated to video publishing cadence
- Self-reported source on inbound lead forms ("where did you hear about us?")
- LinkedIn profile visits spiking within 24–48 hours of a video post
- Inbound DMs from buyers referencing specific video content
The 2025 B2B SaaS funnel data shows MQL to SQL as the key bottleneck, with an average 15–21% conversion rate. Short-form video that pre-educates buyers before they fill out your demo form directly improves that conversion, because an SQL who already understands your product takes half as long to close.
Decision-makers increasingly consume content through social platforms before engaging with vendors or entering formal buying processes, a shift that has created new opportunities for B2B organisations to build awareness and credibility through video.
For teams serious about attribution, I recommend building a simple three-column tracker: video published, week-over-week demo request delta, and qualitative source flags from sales calls. It is not perfect attribution, but it is directionally honest, and far more useful than watching view counts climb while pipeline flatlines.
Our video marketing services are structured specifically around this problem: turning product knowledge, founder thinking, webinars, and demos into short-form assets that support pipeline, not just presence. If you want to explore what that looks like for your team, contact us here.
Conclusion
How do you measure short-form video success? Not with views. With a structured system across three layers:
- Completion rate and watch time are your primary platform signals, optimize these first.
- Engagement rate tells you content quality; benchmark it against your specific platform and account size, not generic industry averages.
- Reach and impressions reveal distribution health, but require platform-specific interpretation, especially post-Meta's 2025 Views migration.
- Pipeline signals, demo requests, inbound DMs, MQL source data, are the only metrics that prove commercial value for B2B SaaS teams.
Build the measurement system before scaling production. The teams winning with short-form video in 2026 are the ones who know exactly which clip moved the needle and why.
Frequently Asked Questions
Q1: What is a good completion rate for short-form video in 2026?
Current benchmarks show YouTube Shorts at 40–55%, TikTok at 40–50%, and Instagram Reels at 45–65%. Aim to be in the upper half of your platform's range. For videos under 20 seconds, a completion rate above 70% is strong on any platform.
Q2: What is a good view count for short-form video for a B2B brand?
View count alone means nothing without context. A 400-view video that drives two inbound demo requests outperforms a 40,000-view video that generates zero pipeline. Focus on engagement rate and downstream action, not absolute view volume. For early-stage founder accounts, 500–2,000 views with a 5%+ engagement rate is a healthy signal.
Q3: How is engagement rate calculated for short-form video?
The formula is: (Likes + Comments + Shares) / Views × 100. Some teams also include saves and reposts. Calculate it per video, not as an account average, so you can identify which content types consistently outperform your baseline.
Q4: Do YouTube Shorts or TikTok have better engagement for B2B?
YouTube Shorts has the highest engagement rate (5.91%) of all short-form video platforms, closely followed by TikTok at 5.75%. For B2B SaaS, YouTube Shorts pairs short-form discovery with longer-form depth in the same ecosystem, making it particularly effective for buyer education and product trust content.
Q5: How do I know if a short video is performing well algorithmically?
Watch the first 24-hour signals: completion rate, share count, and profile visits driven from the video. Platforms use these early signals to determine wider distribution. If completion rate is above your platform benchmark and shares are growing in the first two days, expect organic reach to expand in the following 48–72 hours.
Q6: What tools should B2B teams use to measure short-form video analytics?
Start native: TikTok Analytics, Instagram Reels Insights, and YouTube Shorts Studio each provide completion rate, average watch time, and engagement breakdowns at no cost. Layer in Sprout Social or Hootsuite Analytics for cross-platform aggregation. Connect Google Analytics 4 to track video-driven web traffic and downstream conversions through UTM-tagged bio links and CTA destinations.